How to Back-Test your Expert Advisor
on the MetaTrader4 (MT4) Trading Platform!
This tutorial assumes you have already attached your Expert Advisor to your chart. For instructions on this, visit the tutorial "How to Attach Your Expert Advisor".
1. Confirm that your Expert Advisor is attached to the appropriate chart.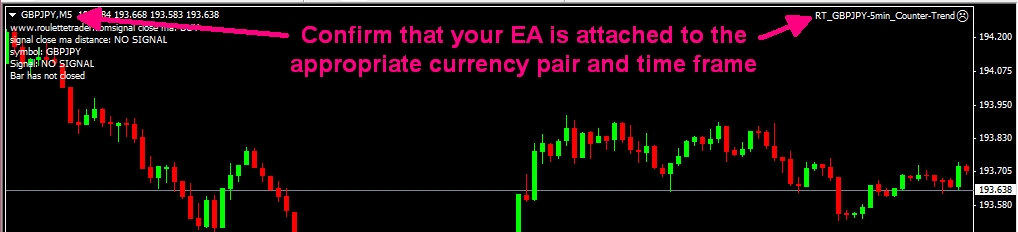
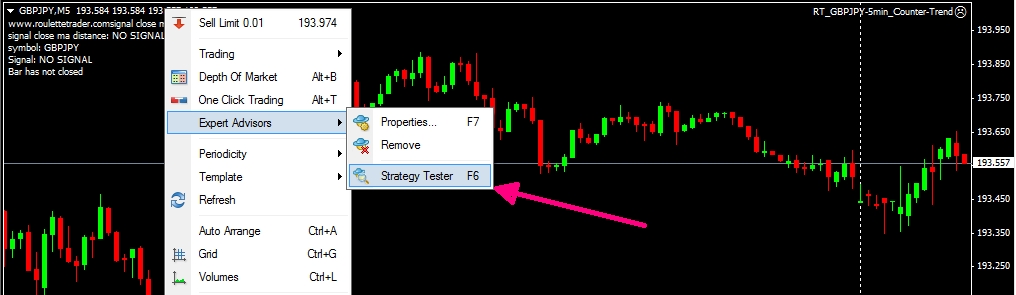
2. Right click on the chart then choose Expert Advisor > Strategy Tester from the pop-up menu.
The Strategy Tester
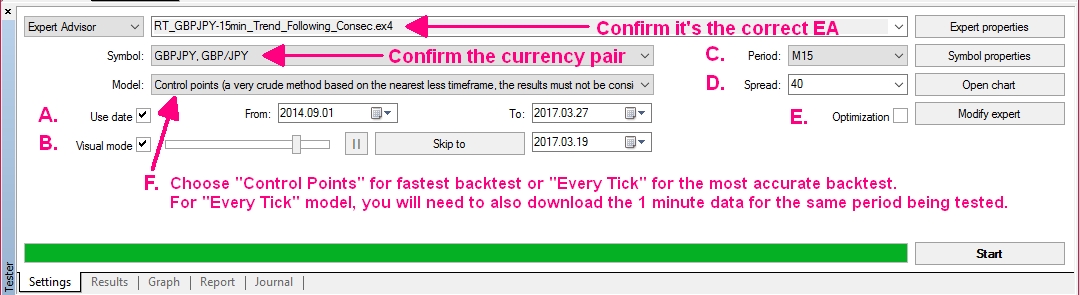
3. The Strategy Tester will open on the bottom of the platform. Here's what the settings are for...
A. Use Date: if this box is checked, it will back-test only this date range. HOWEVER, it can only backtest data that you have available in your charts. Click on the chart you will be testing then click the "Home" key on your keyboard and it will scroll back to the first candle in your history. Hold the "Home" key down to download as much data as your broker will allow. The Strategy Tester cannot test data prior to this regardless of what your date settings are.
B. Visual Mode: This will place the Buy/Sell signals on your chart but it will take a lot longer to perform the back-test if testing a lot of data on small bars of 5-Min or less. The slide bar to the right of Visual Mode controls the speed of the test. Start back-test slow then slide right to maximum speed or it will take forever to run the test.
C. Period: Shows the time frame that you're testing
D. Spread: This shows the broker's spread that the back-test is using. At a 5-digit broker (most brokers) multiply your desired spread by 10 since it will represent points, not pips. So a 4 pip spread should be entered as 40. However, at a 4-digit broker, enter 4 for a 4 pip spread. A setting of "Current" uses the market's current spread. If back-testing on a weekend, manually enter your spread because some brokers widen their spreads on the weekends. This can make a huge difference in your back-test results so if something doesn't look right, check this setting. To see if your broker is 4 or 5 digits, open a EUR/USD chart and count the number of digits after the decimal.
E. Optimization: Leave this unchecked.
F. Choose "Control Points" for fastest backtest or "Every Tick" for the most accurate backtest. For "Every Tick" model, you will need to also download the 1 minute data for the same period being tested. CLICK HERE to download years of 1 minute data. The Roulette Trader EAs only open trades at the opening of a bar so using Every Tick model does not make a significant difference.
4a. Click the "Expert Properties" button to change or optimize your EA settings for back-testing. These are the settings your backtest will use and they are completely independent of your Expert Advisors>Properties settings, which are for live trading only.

4b. You can adjust your settings in the "Value" column then click OK. These settings will ONLY effect your back-test results and not your live trading results. The Start, Step, and Stop columns are for automated optimization, which can take days to run and I do not recommend using it.
4c. In most Roulette Trader EAs, the primary settings to optimize are the Cycle Target, Stoploss, Takeprofit, Min Dist From MA3, Max Dist From MA3, and MA3 Period settings, as I have checked below. When optimizing, change one setting at a time so you know which setting is responsible for changes in the test results.
MA3 SIGNAL ENVELOPES: The Signal Envelope settings measure the distance between MA3 and the candle closing price in pips both above and below MA3. In the Trend-Following EA, MA1 and MA2 must be above MA3 to generate Buy signals and below MA3 to generate Sell signals. In the Consolidation EA, it is the opposite: MA1 and MA2 must be above MA3 to generate Sell Signals and below MA3 to generate Buy signals.


4d. MA3 ENVELOPE EXITS: This function closes trades during spikes of profit that extend into a wider Moving Average Envelope determined by these settings. The Minimum settings should be larger than the Max Distance under the Signal Envelope settings.
4e. BIG CANDLE EXITS: This function closes trades at the close of a large candle (in the direction of profit) based on the candle body size determined by these settings.
4f. MA3 CROSS-OVER EXITS: This function closes trades when the closing price of a candle crosses MA3 by the number of pips (or more) indicated in the setting. This feature is most useful in the Consolidation EA.
5a. If you checked Visual Mode in the step 3: Click START on a Slow setting (circled in image below), then choose a custom template to change your back-tested chart's appearance. You should find Templates named after each robot if you installed them. Note: This step is obsolete if Visual Mode is unchecked.
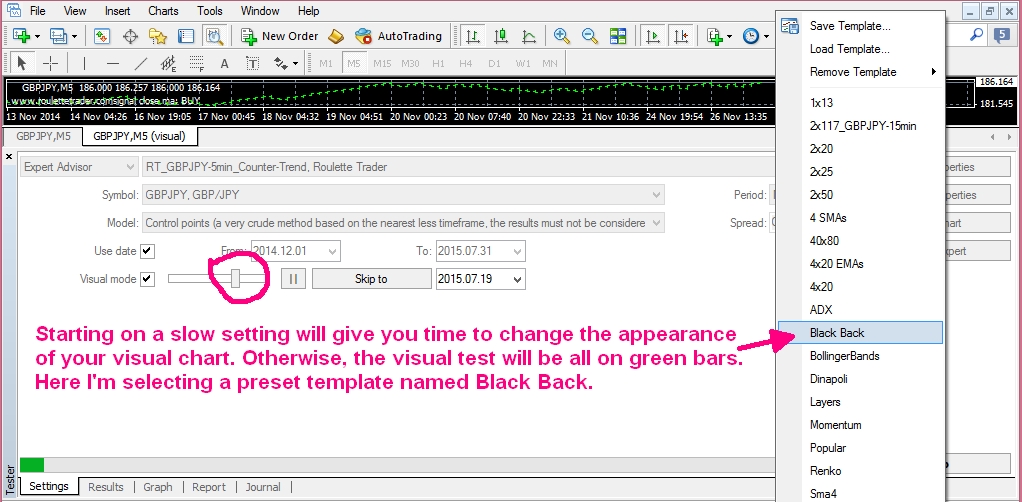
5b. Once you choose your template for the backtest, you can slide the Visual Mode speed all the way to the right for maximum speed.
5c. DATE RANGE: Please note that regardless of the dates you choose, you cannot back-test candlestick data that you do not have downloaded into MT4. To check how far back your data goes back, click on your chart and press the "Home" key on your keyboard. It will take you to the earliest date of your data. Hold the "Home" key down to download as much data as your broker allows. My GBPJPY 15-Min Trend-Following robot includes 15-Min data going back to December 2014 in the History folder. You may replace your data with this file included with the robot to get over 4 years of 15-Min data to run your backtests for that robot. There is a text file in the same folder with instructions on how to do this.
6. After the back-test completes, click the Graph tab to display the equity curve.

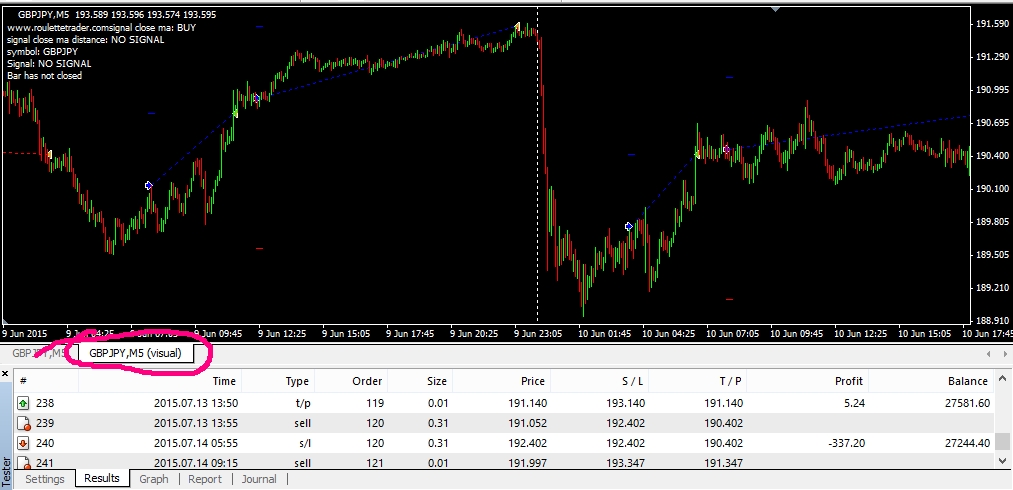
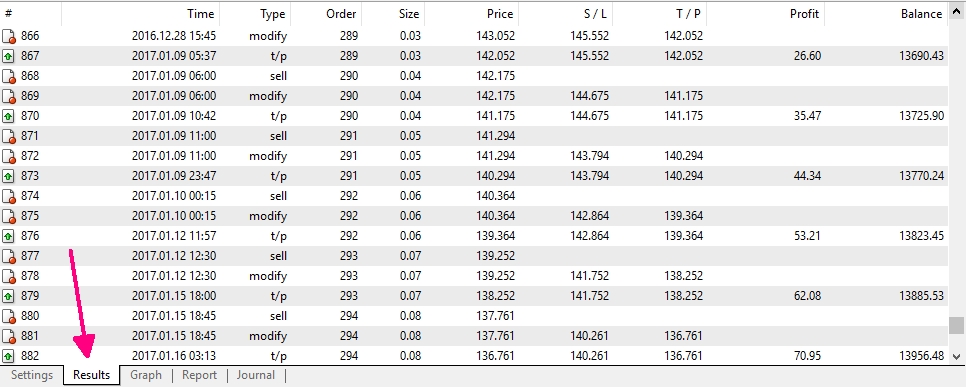
7. Click the Results tab to see the individual trade results.
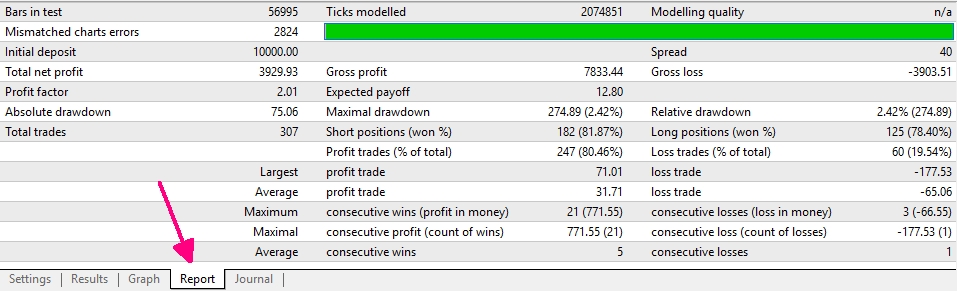
8. Click the Report tab to see a summary of the back-test results.
9. If you checked the box for Visual Mode in Step 3 above, then it would have created a "visual" chart with the trade signals plotted on it. Any chart tab that includes "(visual)" is a back-tested chart and does not update in real time. Blue arrows with blue dotted lines are buy signals. Red arrows with red dotted lines are sell signals.